If you open the dropdown menu ![]() to the right of a field in the Row labels or Column labels areas in the lower areas section of the filed list, you will find the Field settings option. Alternatively, you will find this option via the context menu by right-clicking directly in the Pivot table report (select a cell of the desired field below the headers Row labels/Column labels).
to the right of a field in the Row labels or Column labels areas in the lower areas section of the filed list, you will find the Field settings option. Alternatively, you will find this option via the context menu by right-clicking directly in the Pivot table report (select a cell of the desired field below the headers Row labels/Column labels).
This section describes the adjustments you can make with the field settings.
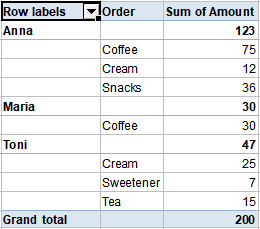
This is illustrated based on the known example data shown in the figure below: The Amount field is dragged into the Value area of the areas section, and the Employee and Order fields are dragged into the Row labels area.
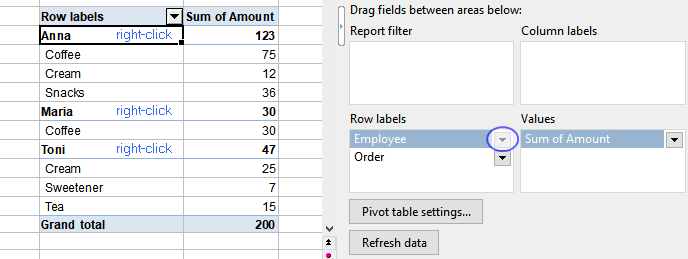
The pivot table report at default values for field settings. Highlighted in blue: selecting the field settings for the "Employee" field
Note: For the sake of simplicity, the descriptions given in this section refer to the arrangement of the fields in the Row labels area. If you drag the fields to the Column labels area instead, the results are basically the same. But they are displayed transposed (from left to right instead of top to bottom).
Field settings, "Subtotals" tab
If you have arranged several fields in a row labels or column labels area, you get partial results for the higher-level field item (Employee) in the pivot table report, as shown in the figure above (for Anna, Maria, Toni). These subtotals are automatically calculated as sums if a number field has been identified in the values area. In the Subtotals tab you can also change the display of the subtotals to other summary functions (e.g. count, average, etc. instead of sums) or hide the display of subtotals completely.
Important: The field settings have an effect for the pivot table only on the field selected in the row/column labels area.
Click on the dropdown menu ![]() to the right of the field (Employee) in the Row labels area (areas section of the field list) and select the Field settings. In the open dialog box, choose the Subtotals tab.
to the right of the field (Employee) in the Row labels area (areas section of the field list) and select the Field settings. In the open dialog box, choose the Subtotals tab.
Here you have the following options:
▪Auto (default): Sums are displayed for the subtotals (Employee, as in the figure above). If the value field (Amount) does not contain numbers, but values with other formats, the Count function is automatically used for the subtotals.
▪None: The subtotals (Employee) are not displayed.
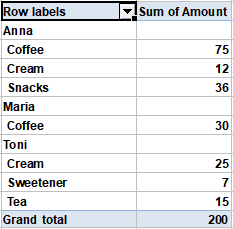 |
| The Pivot table report without subtotals |
▪Custom
| You can choose from various summary functions for displaying subtotals using the Custom option: |
| Sum: The subtotals are displayed as the sum of the single values. |
| Count: Returns the number of single values that occur. Works the same as the COUNTA function. |
| Average: Returns the average value of the occurring single values. |
| Maximum: Returns the largest occurring single value. |
| Minimum: Returns the smallest occurring single value. |
| Product: Returns the multiplied value of the occurring single values. |
| Count numbers: Returns the count of values that are numbers. Works the same as the COUNT function. |
| Standard deviation (sample): Returns the estimated value for the standard deviation of a population based on a sample. Works the same as the STDEV.S function. |
| Standard deviation (population): Returns the standard deviation of a population. Works the same as the STDEV.P function. |
| Variance (sample): Returns the estimated value for the variance of a population based on a sample. Works the same as the VAR.S function. |
| Variance (population): Returns the variance of a base population. Works the same as the VAR.P function. |
Tip 1: It is also possible to combine several custom functions. Each of them is then displayed as a separate row for the subtotal.
Tip 2: If you want to change not only the subtotals but also the other values to a certain display, you can make the required changes in the Values area with the value settings option; see the section Value settings (Values area). If, on the other hand, you want to show or hide the Grand totals for columns/rows, you will find the options available under Pivot table settings.
In the example figure at the beginning of the section, you can see the pivot table report displayed in the outline view. You can use the Form options to customize this view.
Note: The displayed Form can only be customized for fields in the Row labels area. For fields in the Column labels area, the structure formats cannot be set.
In the Row labels area (in the areas section of the field list), click the dropdown menu ![]() to the right of the Employee field and select Field settings. In the open dialog box, choose the Form tab.
to the right of the Employee field and select Field settings. In the open dialog box, choose the Form tab.
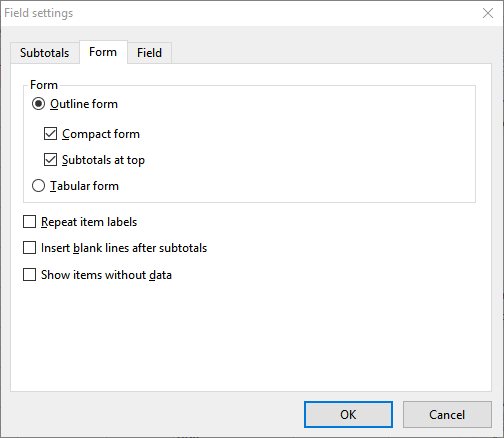
The Field settings dialog box with the default values in the "Form" tab
Form section
Here you can select between the view in Outline form or in Tabular form:
▪In the Outline form – with additionally enabled Compact form – several fields are displayed together in one column, and the lower-level elements are indented into the column. You can also select here whether the subtotals should appear above or below the grouping.
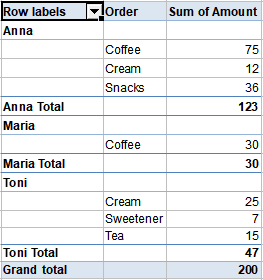
| The following figures illustrate the different presentation variants, depending on the enabled options: |
| Outline form: Compact form enabled; Subtotals at top enabled |
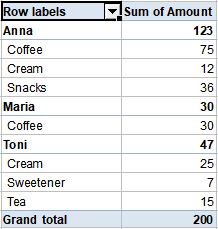 |
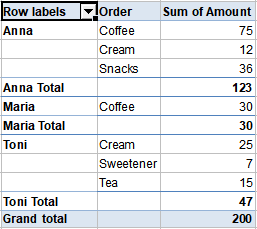
| Outline form: Compact form disabled; Subtotals at top enabled |
 |
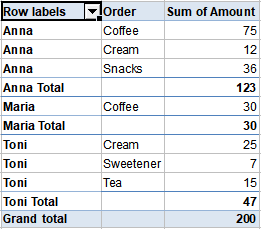
| Outline form: Compact form disabled; Subtotals at top disabled |
 |
▪The Tabular form generally displays a separate column for each field, with the respective field heading:
 |
Further options in the "Form" tab
There are three more options in the lower section of the form tab that you can use as needed to give the pivot table report a better structure.
Please note: The options Repeat item labels and Insert blank lines after subtotals affect only higher-level field items (Employee). The option Show items without data, however, affect only lower-level field items (Order).
▪Repeat item labels
| The item labels of the elements are displayed repeatedly in each row. This option only works for the Tabular form and for the Outline form only if you disable the compact form. |
 |
| Enabled option "Repeat item labels" for Tabular form |
▪Insert blank lines after subtotals
| It can be helpful for the clarity of the pivot table report if a blank line appears after each group of subtotals. Enable the option for this purpose (not available for fields in the column labels area). |
▪Show items without data
| Enable this option to also display those elements that did not contain associated data. |
| Example: Toni did not buy any Coffee. Enabling this option, however will display that item with an empty cell in "Sum of Amount". |
You can give the field a Custom name here so that it appears in the pivot table with a different name. Enable the checkbox and type the new name into the input field (see also Working with the field list: Areas section).