The Outliner allows you to create an outline for a worksheet. In outlined worksheets, you can easily decide whether just the summarized data should be displayed or the detail data should appear as well.
The process of creating an outline is about grouping consecutive cell rows that contain related detail data. For example, if a table contains sales figures for the last few years, with the monthly sales listed below each year, group each list of monthly figures. After that, you can hide/unhide (or, collapse/expand) the monthly sales for each year with a single mouse click.
Outlines can contain various outline levels, allowing you to nest the data to be displayed as desired.
Using the Outline pane
In worksheets containing an outline, a pane named Outline pane is displayed to the left of the document window.
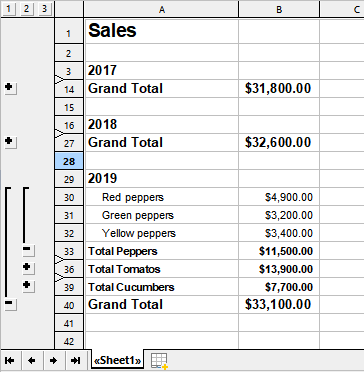
Use the Outline pane to hide/unhide grouped cells:
▪Click the Plus ![]() and Minus
and Minus ![]() signs to hide/unhide groups of cells.
signs to hide/unhide groups of cells.
▪Click the ![]() buttons on top of the Outline pane to determine which outline levels to display. For example, if you click the "2" button, all cells with an outline level between 1 and 2 will be displayed.
buttons on top of the Outline pane to determine which outline levels to display. For example, if you click the "2" button, all cells with an outline level between 1 and 2 will be displayed.
Note: Worksheets can be outlined by row or by column. In a column outline, columns are grouped instead of rows. In this case, Outline pane is displayed above the table.
Using the command group "Outline"
You will find the commands for grouping cells on the ribbon tab Data | group Outliner.
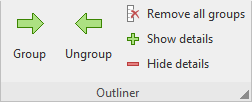
This command group provides the most important icons for working with outlines:
▪Group the selected cells
▪Ungroup the selected cells
▪Clear outline of the selected cells
▪Show details (equivalent to clicking on the Plus icon in the Outline pane)
▪Hide details (equivalent to clicking on the Minus icon in the Outline pane)
The following pages contain detailed information on working with outlines.