In spreadsheets containing nothing but long columns of numbers, it is often hard to interpret their meaning. PlanMaker offers easy ways to turn raw numbers into charts that get the point across.
In this chapter, you will learn everything you need to know about charts. The following topics are covered:
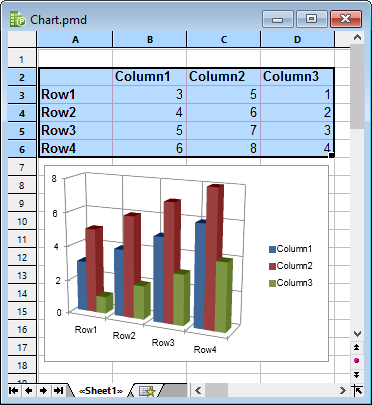
▪Inserting charts
| First, you will learn how to create a chart: Select the cells containing the data to be displayed, choose the ribbon command Insert | Chart frame and select a chart type. |
▪Editing charts
| This section contains all the information you need to edit charts. You will learn how to change the chart type and the arrangement of the data series, how to work with the individual chart elements (data series, axes, legend etc.) and how to change the general chart properties. |
▪Updating charts
| By default, charts are automatically updated when you change the content of any of the cells they are based on. So if values in these cells change, the chart is updated immediately. If desired, you can disable automatic updating. |
▪Moving charts to another worksheet
| The ribbon command Chart | Chart location allows you to move a chart to another worksheet or even create a separate chart worksheet for it. A chart worksheet contains no table cells but solely the chart in its full size. |
▪Saving charts as pictures
| The ribbon command Chart | Save chart as a picture allows you to save an image of a chart in a picture file. |