You will learn how to edit charts in the next sections. The information covers the following topics:
| Use the ribbon command Chart | Chart type to determine the form in which the data will be represented in the chart – for example, as bars, lines or in the form of a pie chart, etc. |
▪Changing the arrangement of data series
| On the ribbon tab Chart you can specify whether you want to evaluate the data series to be displayed as Series in columns or Series in rows. |
▪Showing/hiding chart elements
| A chart contains various elements, such as data series, axes, a legend, etc. You can use the ribbon command Chart | Add chart element to show or hide certain elements of the chart if necessary. |
| You can select the elements of a chart by clicking on them and then edit them. You will learn how to do this in this section. |
▪Changing chart properties via the dialog box
| In addition to the properties of individual chart elements, there are also common chart properties that you can change. These include various layout options, the chart type, settings for the data series, etc. You can change these options on the contextual ribbon tab Chart (see below) or in the Properties dialog box (accessible via the context menu). |
For basic information on working with objects, see Objects.
Using the ribbon tab "Chart"
When you select a chart, the contextual ribbon tab Chart appears automatically.
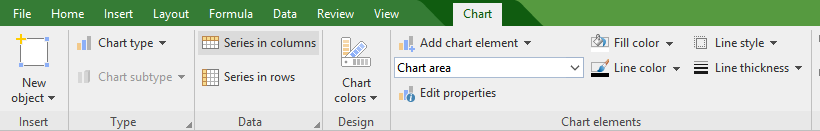
The contextual ribbon tab "Chart", left section
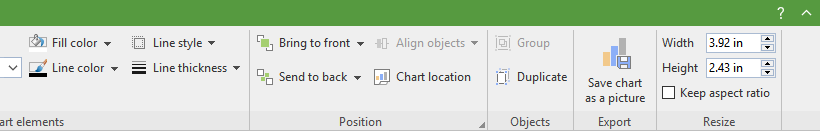
The contextual ribbon tab "Chart", right section
This ribbon tab contains icons for the most important functions for editing charts:
▪New object: This option allows you to insert a new object into the document, and different object types are available.
▪Chart type/Chart subtype: This option allows you to select a chart type. (A subtype is only available for some chart types.) For more information, see Changing the chart type.
▪Series in columns/rows: Specify whether the data to be displayed is to be evaluated column by column or row by row, see Changing the arrangement of data series.
▪Chart colors: This option allows you to change the color scheme of the chart.
▪Add element: This option allows you to show or hide chart elements such as axis titles, gridlines, legends, etc. For more information, see Showing/hiding chart elements.
▪List of all chart elements contained in the chart. If you click on an element in the list, it will be selected in the chart – if you select an element in the chart, it will be displayed in the list.
▪Edit properties: You click on this option to edit the selected chart element and the corresponding dialog box opens. For more information, see Editing chart elements.
▪Fill color, Line color, Line style, Line thickness: You can use these options to change the fill and border lines of the selected chart elements. For more information, see Editing chart elements.
▪Bring to front, Send to back: These options allow you to arrange the order of overlapping object frames. For more information, see Changing the order of objects.
▪Align objects: This option allows you to align or evenly distribute two or more object frames. For more information, see Aligning and distributing objects.
▪Chart location: For more information, see Moving charts to another worksheet.
▪Group: This option allows you to combine several selected objects into one unit, which can then be treated like a single object. For more information, see Grouping objects.
▪Duplicate: This option allows you to create an immediate copy of the selected chart.
▪Save chart as a picture: Save an image of a chart as a picture file, see Saving charts as pictures.
▪Width, Height: These options change the size of the chart. For more information, see Changing position and size of objects.
Using the dialog box
Many (but not all) of these functions and some additional options can be found in the Object properties dialog box that you open via the context menu (entry Chart: Properties).
Alternatively, you can open the dialog box by clicking on the group arrow![]() in the bottom right corner of any command group of the ribbon tab Chart.
in the bottom right corner of any command group of the ribbon tab Chart.
All options of the dialog box are explained in Changing chart properties via the dialog box.