Once you have created a pivot table, the Field list appears on the right side of the sidebar with the upper Fields section and the lower Areas section. It is the central element of a pivot table because here you control which data is displayed in the target range of the pivot table (the Pivot table report) and how the data is arranged.
Note: The field list is displayed only when you place the mouse cursor in the pivot table report.
Structure of the field list
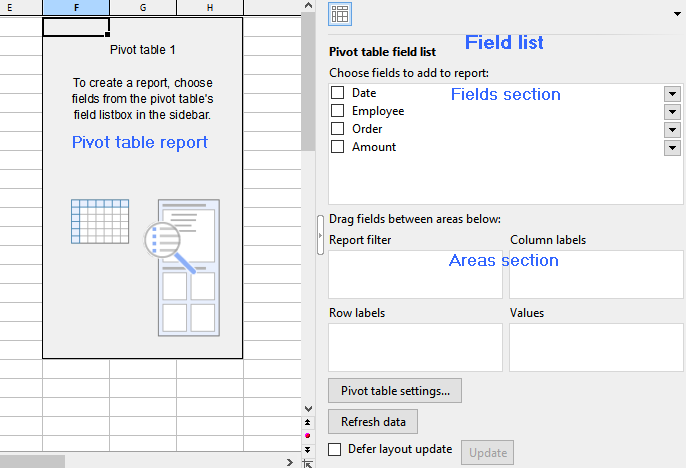
On the left the still blank pivot table report; on the right the field list with the "Fields section" above and the "Areas section" below.
Fields section: In the upper part of the field list, the headings from the columns of the source data are grouped in their original sort order. The order of the columns from left to right in the source data corresponds to the order from top to bottom in the fields section. These elements are not called "Columns" here, but "Fields".
Areas section: In the lower part of the field list, you can drag the fields from the upper fields section. Depending on how these fields are arranged, you can define the structure of the pivot table. As soon as you have placed at least one field in one of the 4 areas of the areas section, results appear in the pivot table report.
The areas section is divided into the following 4 individual areas:
▪Row labels
| If you drag a field into this area, the data from this field is grouped by rows in the pivot table report. In this context, grouping means that identical elements from a column of the source table appear only once and are totaled. You can also drag several fields into this area; the added fields then also form further subgroups line by line. The field that appears at the top of the row labels is the higher-level sort criterion. Fields further down are treated as lower-level and are displayed in the pivot table report according to this structure. |
▪Column labels
| Same procedure as for row labels, but grouping is by columns. |
▪Values
| This is the most important area: The data records of the field dragged here are summarized in the pivot table report, for example, amount totals. This is why fields with numbers usually appear here. |
▪Report filter
| Allows you to show and hide selected data records in the pivot table report, based on the field that is inserted in the report filter (see also Sorting and filtering pivot tables). |
Tips to display the field list in the sidebar:
Adjust the Field list width as needed by dragging the mouse cursor along the inner edge of the sidebar.
To show or hide the field list, click on the narrow vertical button with the small arrow on the edge of the sidebar.
Use the ribbon command View | group Windows | Pivot table sidebar | Show at left or Show at right to choose at which side of the document the field list should be displayed.
In the next sections you will find practical information on how to use the field list.