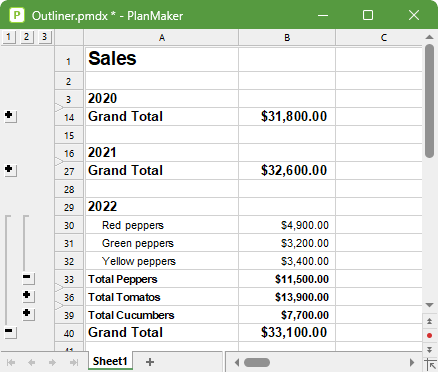
The Outliner allows you to create an outline for a worksheet. You can then easily decide via a mouse click whether only the most important data or also detailed data should be displayed.
In order to outline a worksheet, you have to group the related detailed data. If, for example, a worksheet contains sales figures for several years, with the monthly sales listed below each year, group each list of monthly figures. From then on, you will be able to show or hide them via a mouse click – depending on whether you only want to view the annual sales or also the monthly sales.
Outlines can also contain several levels – thus you can group data again within a group of data.
Outline pane
As soon as a worksheet contains grouped data, an Outline pane is displayed to the left of the document window.

Use this Outline pane to determine which detailed data should be displayed via a mouse click:
▪By clicking on the plus ![]() and minus
and minus ![]() signs in the Outline pane, you can show or hide any groups of detailed data individually.
signs in the Outline pane, you can show or hide any groups of detailed data individually.
▪Use the ![]() buttons at the top of the Outline pane to specify that only detailed data from a certain level should generally be displayed. If, for example, you click on the "2" button, only rows of the first and second outline levels will be displayed.
buttons at the top of the Outline pane to specify that only detailed data from a certain level should generally be displayed. If, for example, you click on the "2" button, only rows of the first and second outline levels will be displayed.
Note: Worksheets can be outlined by row or by column. In a column outline, columns are grouped instead of rows. In this case, the Outline pane is displayed above the worksheet.
Using the command group "Outline"
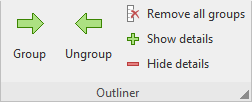
You will find the commands for grouping cells on the ribbon tab Data | group Outliner.

This command group provides the most important icons for working with outlines:
▪Group the selected cells
▪Ungroup the selected cells
▪Remove all groups
▪Show details (equivalent to clicking on the plus sign in the Outline pane)
▪Hide details (equivalent to clicking on the minus sign in the Outline pane)
The following pages contain detailed information on working with outlines.