Before we end this PlanMaker tour, let's take a quick look at charts.
It is often difficult to interpret the meaning of spreadsheets consisting of long columns of numbers. PlanMaker thus has its own chart module for the optical preparation of data from your worksheets.
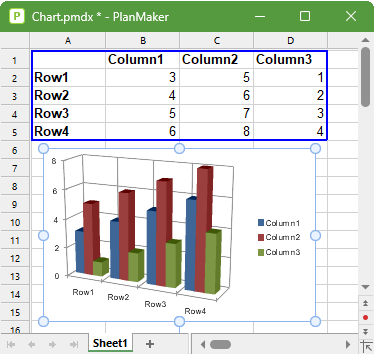
To insert a chart, first select the values to be displayed.
Then choose the ribbon command Insert | Chart frame ![]() (click directly on the icon itself). A dialog box appears in which you only have to select the desired chart type and the completed chart appears in the document.
(click directly on the icon itself). A dialog box appears in which you only have to select the desired chart type and the completed chart appears in the document.
For more information on this topic, see Charts.