You can use charts to graphically display the numeric values of a worksheet and thus present the "raw numbers" more clearly.
In this chapter, you will learn everything you need to know about charts. The following topics are covered:
▪Inserting charts
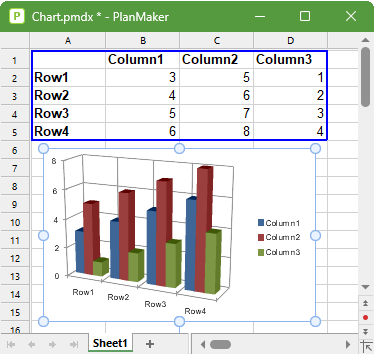
| First, you will learn how to create a chart: Select the cells containing the data to be displayed, choose the ribbon command Insert | Chart frame and select a chart type. |
▪Editing charts
| This section contains all the information you need to edit charts. You will learn how to change the chart type and the arrangement of the data series, how to work with the individual chart elements (data series, axes, legend, etc.) and how to change the general chart properties. |
▪Updating charts
| A chart always retrieves the values to be displayed from the cells that were selected when the chart was created. If values in these cells change, the chart will be updated immediately. If desired, however, you can disable this automatic updating. |
▪Moving charts to another worksheet
| The ribbon command Chart | Chart location enables you to move a chart to another worksheet or even create a separate chart worksheet for it. This chart worksheet contains only the full-sized chart without any cells. |
▪Saving charts as pictures
| The ribbon command Chart | Save chart as a picture enables you to save an image of a chart in a picture file. |