Before we end this tour, let's have a quick look at charts.
In spreadsheets consisting of nothing but long columns of numbers, it is often hard to interpret their meaning. PlanMaker provides easy ways to turn raw numbers of a table into charts that get the point across.
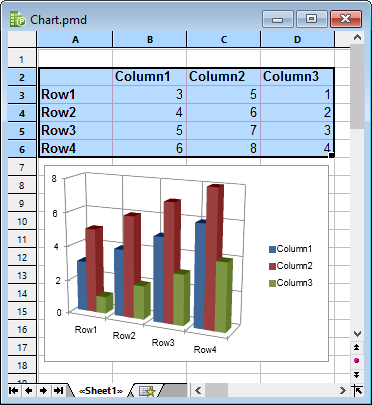
To insert a chart, first select the values to be displayed.
Then choose the ribbon command Insert | Chart frame ![]() (click directly on the icon itself). The program opens a dialog box in which you have to specify the chart type. When done, the chart is inserted into the worksheet.
(click directly on the icon itself). The program opens a dialog box in which you have to specify the chart type. When done, the chart is inserted into the worksheet.
For more information about this topic, see Charts.