Charts consist of several components. In addition to the data series themselves, for example, there are axes, a legend, etc. These individual components of a chart are called the chart elements.
The following figure shows the most important chart elements:
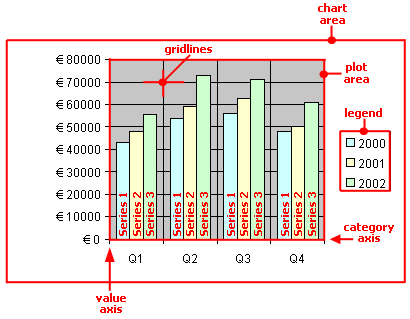
Series 1, Series 2, etc. represent the chart's data series.
Three-dimensional chart types contain some additional chart elements (floor, walls, etc.), which will also be described on the following pages.
Each of these chart elements can be selected at the click of a mouse and then edited.
Selecting chart elements
To select a chart element, first click on the chart itself to select it and then click on the desired chart element. To select a data series, for example, click on any value within this series.
Note: To select a single value within a data series, first click on the data series and then click on the desired single value.
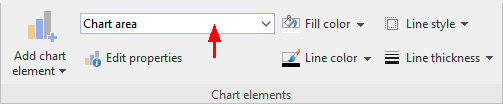
Tip: Alternatively, you can select chart elements by expanding the list of elements on the ribbon tab Chart | group Chart elements and selecting the desired element from it. Here, you can always see which chart element is currently selected.
Changing the position and size of chart elements
The position and size of some chart elements (for example, the legend) can be changed. To move an element, select it and then drag it to the desired position. To change its size, drag one of the round handles surrounding the element.
Changing the fill and borders of chart elements
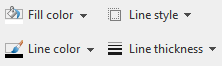
The fill color and border lines of chart elements can be applied directly with the buttons of the command group Chart elements on the ribbon tab Chart. To do so, select a chart element and make the desired adjustments using the buttons Fill color, Line color, Line style and Line thickness.
Note: In the case of the buttons Fill color and Line color, the last color that you used will be applied again when you click directly on the icon itself. By clicking on the icon's arrow, you open the color palette.
Only for the Fill color button: If you click on the icon's arrow, you can use the entry More Fills to also apply more complex fills. For more information, see Object properties, Fill tab. By clicking on the entry More colors, you reach a dialog box with color definitions, which you use according to the descriptions of the section Document properties, Colors tab.
You will also find fill and border settings via the dialog box of the chart elements (see next paragraph). You can also change other properties here, depending on the type of chart element.
Changing properties of chart elements
In addition to changing the properties of the chart itself, as described later in Changing chart properties via the dialog box, you can also edit the properties of individual chart elements.
To change the properties of a chart's legend, for example, proceed as follows:
| 1. | Select the chart by clicking on it. |
| 2. | Right-click on the legend to open its context menu. |
| Android/iOS: In these versions, you can also open the context menu with your finger: Just tap on the screen and hold your finger there for about a second. |
| 3. | In the context menu, choose the command Legend: Properties (not the command Chart: Properties). |
A dialog box will now appear in which you can make the desired settings.
Tip: Alternatively, you open the dialog box via the ribbon command Edit properties ![]() .
.
Even faster: Open the dialog box by double-clicking on the desired element.
The properties that you can change in this dialog box depend on the type of chart element for which you opened it. The following sections provide more information about all available chart elements and their respective properties:
▪Walls (three-dimensional charts only)
▪Floor (three-dimensional charts only)