Syntax:
LOGEST(y_values [, x_values] [, Constant] [, Stats])
Description:
Returns statistics of an exponential regression.
Exponential regression is a statistical technique that adapts an exponential curve to a set of data points (for example, the results of a series of measurements).
The equation for this exponential curve is:
y = b*m^x
If more than one range of x-values is given, the equation is:
y = b * (m1^x1) * (m2^x2) * ... * (mn^xn)
The LOGEST function calculates this exponential line from the given y values and x values, and then returns an array in the form {mn, mn-1, ... , m2, m1, b}.
Additionally, if the optional argument Stats is used, several statistics of the regression (standard error, coefficient of determination, etc.) are appended to the resulting array.
The RKP function expects the following arguments:
y_values: Here you specify the existing y-coordinates, that is, the dependent values. y_values can be either a cell reference or an array.
x_values: Here you can optionally specify the x-coordinates, that is, the independent values. Also x_values can be either a cell reference or an array. If x_values are omitted, the values 1, 2, 3, ... will be used automatically. (according to the number of existing y_values).
Constant (optional) is a logical value that lets you specify if the constant b should be calculated automatically or forced to equal 1 (one):
TRUE or omitted: b will be calculated from the given data.
FALSE: b is forced to equal 1 (one). The m coefficients are adjusted accordingly.
Stats (optional) is a logical value that lets you specify if additional regression statistics should be returned:
FALSE or omitted: Do not return additional statistics.
TRUE: Return additional regression statistics. In this case, a matrix in the following form will be returned:
{mn, mn-1, ... , m2, m1, b; smn, smn-1, ... , sm2, sm1, sb; R2, sey; F. df; ssreg, ssresid}
A graphical representation of this array would look like this:
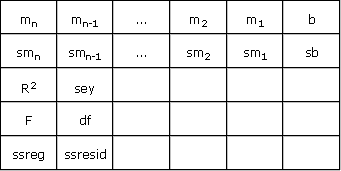
The abbreviations used in this illustration represent the following values:
Abbreviation |
Explanation |
sm1, sm2, etc. |
Standard error for the coefficients m1, m2, etc. |
sb |
Standard error for constant b |
R2 |
Square of the Pearson product moment correlation coefficient |
sey |
Standard error for y |
F |
F statistic |
df |
Degrees of freedom |
ssreg |
Regression sum of squares |
ssresid |
Residual sum of squares |
Note:
Formulas using this function have to be entered as an array formula. For more information, see Working with arrays.
See also: