You have already created a pivot table using the ribbon command Insert | group Tables | Pivot table ![]() . The field list with the fields section and the areas section is on the right-hand side, but the target range of the pivot table (the pivot table report) is still blank.
. The field list with the fields section and the areas section is on the right-hand side, but the target range of the pivot table (the pivot table report) is still blank.
This section explains how to drag elements step-by-step from the fields section to the areas section in the field list in order to display meaningful results with different characteristics in the pivot table report.
If you are already familiar with the structure of a pivot table, you can skip this section.
Tip 1: You can drag the fields to the desired area with the mouse. You can also set a check mark in front of the relevant field in the fields section. PlanMaker then automatically assigns the field to an area in the areas section. Fields with numbers are placed in the values area; all other formats, such as text and date, are placed in the row labels area.
Tip 2: Fields can be dragged back and forth not only between the fields section and the areas section, but also between the individual areas of the areas section and within the areas themselves, so you can easily swap the position of the fields.
Exercise 1: Adding a field to the "Values" area
In the fields section, set a check mark in front of the Amount field or use the left mouse button to drag the field down directly to the Values area of the areas section.
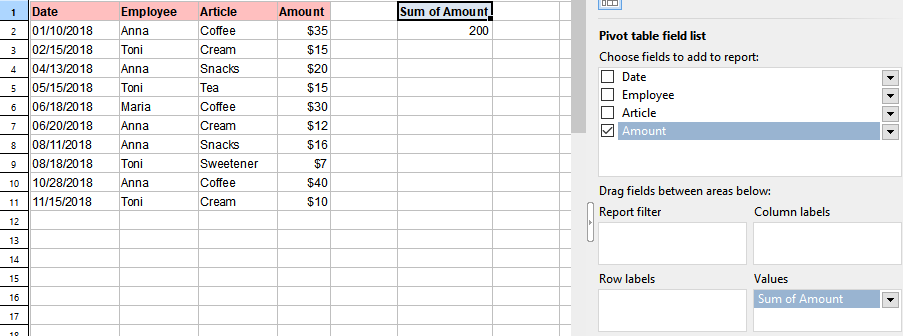
The unchanged source data (left), the result of the pivot table (middle) and the field list with the selected fields for Exercise 1 (right)
▪The field element "Sum of amount" will appear in the Values area of the field list.
▪In the pivot table report, the value field with the header "Sum of amount" will now be displayed instead of the blank report.
▪All values from the Amount field are summed up to a grand total in the pivot table report.
Exercise 2: Adding a field to the "Row labels" area
Now set an additional check mark in front of the Employee field in the fields section or use the left mouse button to drag the field down directly to the Row labels area.
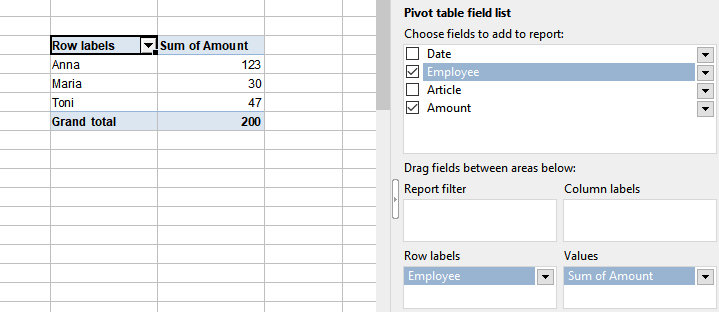
The result of the pivot table (left) and the field list with the selected fields for Exercise 2 (right)
▪The field element "Employee" appears in the Row labels area of the field list.
▪In the pivot table report, there is now a row field with the header "Row labels". Below the row field, the employees are arranged by row and each name only appears once.
▪The value field with the header "Sum of amount" in the pivot table report displays the expenses totaled and broken down by employee.
Exercise 3: Adding a field to the "Column labels" area
You can also display the result by columns instead of by rows. To do so, drag the same Employee field to the Column labels area.
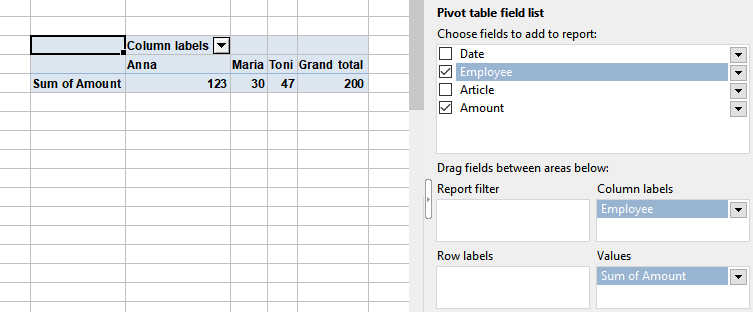
The result of the pivot table (left) and the field list with the selected fields for Exercise 3 (right)
▪The field element "Employee" appears in the Column labels area of the field list.
▪In the pivot table report, a column field with the header "Column labels" is displayed and the employees are arranged by column. Each name only appears once here.
▪The expenses are summed in the value field "Sum of amount" of the pivot table report and are broken down by employee.
Exercise 4: Adding a second field to the "Row labels" area
Drag the Employee field back into the Row labels area, and set an additional check mark in front of the Article field.
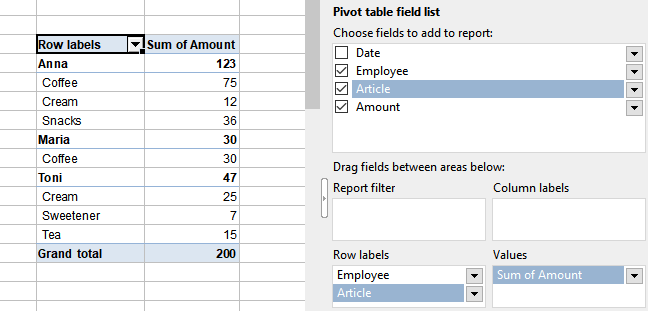
The result of the pivot table (left) and the field list with the selected fields for Exercise 4 (right)
▪In the pivot table report, employees are grouped with their totaled article types under "Row labels". Since the Employee field is at the top of the row labels area, it is the primary criterion and is thus displayed as the higher-level field in the pivot table report.
▪The amounts for purchased article items are broken down by employee in the "Sum of amount" value field in the pivot table report, and partial results are displayed as subtotals per employee.
Note: You may have the article items in the pivot table report grouped as an indented column to the right of the employees. The structure of the results shown here is based on PlanMaker's default settings. For information on customizing the form, see Configuring pivot tables: Field settings.
Exercise 5: Using "Column labels" and "Row labels" together
Drag the Article field to the Column labels area, while the Employee field remains in the Row labels area.
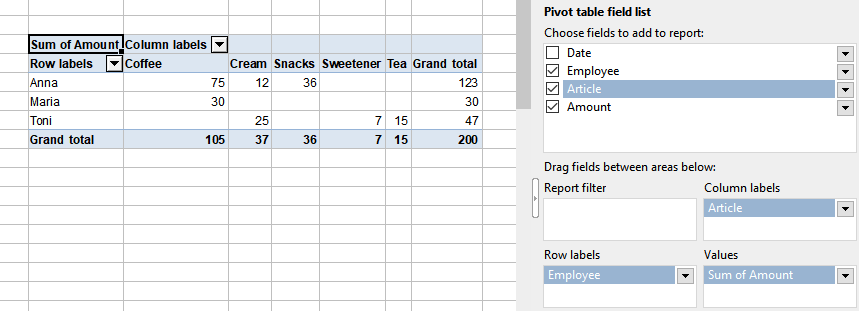
The result of the pivot table (left) and the field list with the selected fields for Exercise 5 (right)
▪You will see the same results as in Exercise 4 but presented as a cross-classified table. The intersecting fields without existing values (for example, Anna did not buy sweetener) are displayed as empty cells.
Exercise 6: Using "Column labels" and "Row labels" together with multiple fields
Finally, drag the Date field to the Row labels area below the Employee field.
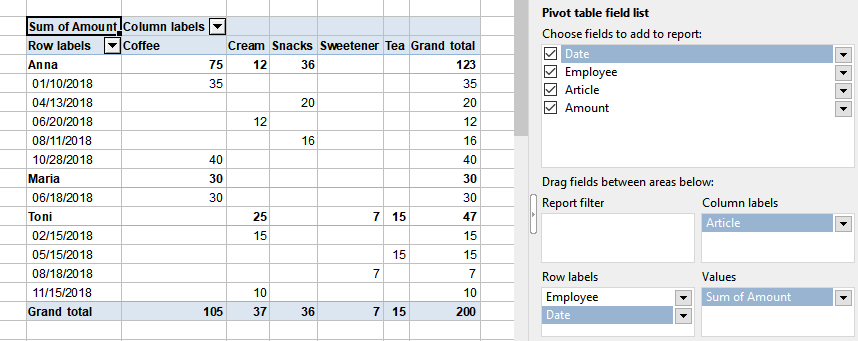
The result of the pivot table (left) and the field list with the selected fields for Exercise 6 (right)
▪The date of the article purchased by employees is also displayed in the pivot table report, grouped directly below the employees in this example. A grouping of the items as an indented column to the right of the employees could also appear, depending on the settings in PlanMaker.
Note 1: You can drag multiple fields into the row and/or column labels for evaluation purposes, but your pivot table will also quickly become increasingly unclear as a result.
Note 2: If there are multiple fields in an area, the order of the fields determines the structure of the outline levels displayed in the pivot table report. You can change this order at any time by dragging the field up or down within the area.
Exercise 7: Adding a field to the "Report filter" area
Drag the Date field from the Row labels area to the Report filter area and the Article field back to the Row labels area.
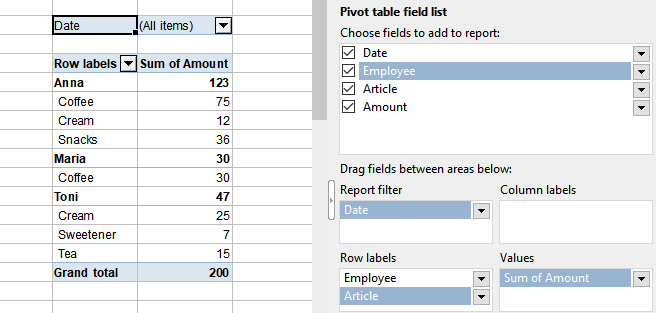
The result of the pivot table (left) and the field list with the selected fields for Exercise 7 (right)
▪A Report filter has been added for the Date field, which is integrated as a new row above the pivot report.
▪Above the pivot report, you can open a dropdown menu to the right of (All items) ![]() and filter by date values displayed in the list. First, all date values are selected, indicated by the check mark in front of them. You can filter out the undesired date items from the pivot report by removing the check marks.
and filter by date values displayed in the list. First, all date values are selected, indicated by the check mark in front of them. You can filter out the undesired date items from the pivot report by removing the check marks.