In addition to the normal tables (see chapter Tables in worksheets), there are also Pivot tables. You can use the ribbon command Insert | Pivot table to create a pivot table based on your existing source data.
What exactly is a pivot table?
A pivot table is an optimal tool for providing large amounts of data in a meaningful form. The generated pivot data can be structured, summarized, filtered and analyzed according to different perspectives. The source data remains unaffected.
Reports using pivot tables are particularly suitable for data sets with many different elements and criteria, which are predominantly similar and interdependent, such as sales reporting.
What is the advantage of pivot tables compared to "normal" tables?
In addition to clarity, pivot tables are much better suited to data analysis than "normal" tables. If you would like to ask complex questions about extensive data, for example, "How many sales did an employee make for which articles at what time?", it would be quite laborious if you had to extract this information directly from a normal table. You would have to sort the data records first, then filter them, use commands and finally prepare them. Pivot tables reduce the number of work steps and enable a much better presentation of the desired information.
Data resources can be edited directly within your PlanMaker worksheet and also by importing data from external PlanMaker and Microsoft Excel files.
Pivot tables illustrated by an example
The functionality of pivot tables is illustrated here with a simplified example, which is used throughout the chapter for description purposes.
Here, you can see sample data records in PlanMaker from which a pivot table is to be created. The company employees had various expenses for their break room supplies throughout the year. Some employees and some articles appear several times in the relevant columns.
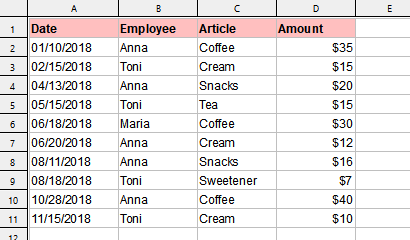
Source data for the pivot table
Note: Number formatting of the source data is not applied to pivot tables. For more information on formatting values in the created pivot table, see Value settings (Values area).
As an evaluation, the following pivot table could be created: Here, the employees are clearly listed with the sums of their purchased articles and the grand total of all expenses.
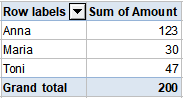
Variant 1 of a pivot table (view of the employees)
However, this pivot table can also be created: Here, the purchased articles are arranged in a totaled overview.
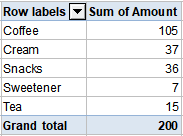
Variant 2 of a pivot table (view of the articles)
Above all, the possibility of grouped arrangement shows the major advantages of pivot tables: Here, employees and articles are displayed together and nested in one overview.
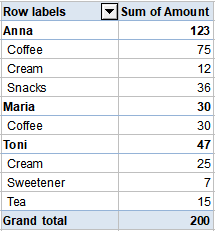
Variant 3 of a pivot table (view of employees with grouped articles)
It can be seen from these examples that, depending on the question addressed to the existing data, different statements can be made with pivot tables.
The following sections clarify how to obtain different perspectives on pivot data and what settings you can make to obtain a suitable presentation of your results:
▪Starting with the pivot table field list
▪Configuring pivot tables with the field list
▪Sorting and filtering pivot tables